| Communication Research Lab Week 5 - Critical evaluation of an empirical report. Writing the Method section. How well does the media do research: the global reputation of universities. |
We have kept the work to a minimum this week knowing you will be
conscientiously writing your Proposal due next week. There is a new Shockwave/Flash tutorial on
the Method section and an example of what a typical Method might look
like below. Myra has a powerpoint on the Method as well.
Evaluating Social Research
You've been asked to search electronic databases and find a range of peer-reviewed articles to use in the Literature Review of your Communication Research project. In order to get a better idea of the range of methods and approaches that can be used in communication research, we've included samples on a range of different topics from recent journals as examples. Click on the link which should take you directly to the journal in the database. If you are accessing this exercise from outside the university, you may need to:
go the library homepage
select UWS catalogue
select journal title
enter the title
select the volume and issue no
find the article
Exercise 5.1: Critique a research paper via its Method:
From the links below, choose at least two of the Methods (you can do more), read them through and compare the methods and approaches used by each researcher. Note the use of the various technical elements of research reports that we have already noted - these include the use of a literature review, a detailed and comprehensive method section as well as a discussion section which analyses and critiques the results in an informed manner. The discussion often reflects the results in the light of other studies referred to in the introduction. In your summary, briefly describe the following:
You could also comment on the:
Method A: Usability study
Hall, M., de Jong, M., & Steehouder, M. (2004) Cultural Differences and Usability Evaluation: Individualistic and Collectivist Participants Compared. Technical Communication, Nov, 51, No 4, pp 489-503.
http://ezproxy.uws.edu.au:2048/login?url=http://proquest.umi.com/pqdweb?did=762931371&sid=1&Fmt=4&clientId=8429&RQT=309&VName=PQDAbstract
Hall et al compare the behaviour and attitudes of participants from different cultures in two types of usability tests. The usability evaluation brought to light many problems in a Web site that may be expected to meet the needs of users all over the world. Study shows that retrospective think-aloud protocols are less affected by cultural differences than the plus-minus method.
Method B: Experiment
Rose, G., Evaristo, R., & Straub, D. (2003). Culture and Consumer Responses to Web Download Time: A Four-Continent Study of Mono and Polychronism. IEEE Transactions on Engineering Management, 50, (1), pp 31-44.
http://ezproxy.uws.edu.au:2048/login?url=http://dx.doi.org/10.1109/TEM.2002.808262Abstract:
Most e-commerce sites would like to include as much relevant and sales-inducing content on their pages as possible. Unfortunately, resulting download delays may lead to consumer frustration and a negative attitude toward the product or service displayed. But is frustration with download delay a universal problem or is it culture-specific? How should firms view this problem? These are the primary research questions investigated in the current study. An experiment conducted on four continents was selected as an appropriate research method to answer those questions. Country sites were selected for differing cultural senses of time and how this might affect individual responses to download delay. Our sample included the US and Finnish cultures representing monochronic cultures and Egyptian and Peruvian cultures representing polychronic cultures. Consistent with the proposed hypotheses, subjects from polychronic cultures were significantly less concerned with download delays than subjects in monochronic cultures. Similarly, perceived wait times varied significantly between the mono- and polychronic groups. Practical insights derived from this study enable specific suggestions on customization of web page content richness as well as infrastructure requirements based on the cultural identity of the intended e-Consumer. Moreover, results suggest theoretical implications for future research.
Method C: Text Analysis
Durack, K.T. (1998). Authority and audience-centered writing strategies: Sexism in 19th Century Sewing Machine Manuals. Technical Communication, May, 45 (2) pp. 180-196.
http://ezproxy.uws.edu.au:2048/login?url=http://proquest.umi.com/pqdweb?did=29224118&sid=1&Fmt=4&clientId=8429&RQT=309&VName=PQD
Abstract
Durack examines audience-centered writing strategies in two 19th-century sewing machine manuals, considers the difference between nonsexist and gender-neutral writing and concludes that sexism in technical writing may sometimes be impossible.
Method D: Survey
Young, K. (2009). Online Social Networking: An Australian Perspective. International Journal of Emerging Technologies and Society, 7 ( 1), pp. 39 - 57.
http://www.swin.edu.au/hosting/ijets/journal/V7N1/pdf/Article4Young.pdf
Abstract
This paper reports the findings of a survey conducted in Australia in 2007/08 that investigated the experiences of online social network users aged between 15-65 years. This research is underpinned by two socio-cultural theories of learning: Situated Cognition and Activity Theory, and has a particular emphasis on online identity creation. Both quantitative and qualitative data are reported on issues of privacy, relationship between online and offline friends, time spent engaged in online social networking activities, use of photographs and status features and positive and negative experiences associated with online social networking. The findings are then interpreted from a socio-cultural perspective of learning.
Method E: Web-based content analysis
Wurtz, E. (2005). A cross-cultural analysis of websites from high-context cultures and low-context cultures. Journal of Computer-Mediated Communication, 11 (1) [online] http://jcmc.indiana.edu/vol11/issue1/wuertz.htmlAbstract
The aim of this study is to explore and identify the strategies used by High-Context cultures in utilizing the Interne - a largely Low-Context medium - for communication and marketing purposes. It is hypothesized that individuals in High-Context cultures are more likely to adopt the visual effects offered by the Internet to convey their messages efficiently than their Low-Context counterparts. How might High-Context cultures make the most of the potentials offered by the Internet generation of today? Assuming that visual communication is a high priority in the design of High-Context websites, how do the visual methods used on websites vary according to the communication styles in different cultures? Using Hall's High- and Low-Context dimensions as the main parameters, an exploratory analysis of McDonald's websites identified five different strategies by which visual communication is used to support High-Context communication traits
Method F: Focus Group
Kolmet, M., Marino, R. & Plummer, D.,(2006). Anglo-Australian male blue-collar workers discuss gender and health issues. International Journal of Men's Health, 5 (1) Spring, p.81(11). (search for this)
Abstract
This qualitative research project investigated male blue-collar workers' understanding of health determinants, gender issues related to health, and workplace health promotion. It is theorised that social and cultural interpretations of masculine and feminine selves that are associated with biological male and female bodies have an important impact on men's health. Strong commitment to the male gender role may lead to stress and dysfunction and restrict the types of coping strategies available to some males. Blue-collar workers' insight into health determinants includes behavioural risk factors such as maladaptive behaviours, psychosocial risk factors such as low perceived power and self-efficacy, and social circumstances such as poverty, stressful work, and lack of control over one's life patterns. We conclude that opportunities exist to support and promote the health status of male blue-collar workers in the workplace.
The Method section is simply where you tell a lay reader what was done, with whom, and how data was obtained. Anyone reading this section should be able to replicate a particular piece of research from the information contained in this section. Use of sub-headings is useful here could include overview, sample, sampling, instrument(s), and procedures. An example follows:
Real-time versus
asynchronous online interaction (example)
Method: (Use all the sub-headings here)
Overview: Two sets of groups were established from Communication students at the University of Western Sydney. Students discussed the same two questions on a real-time chat system and a bulletin board system.
Sample: A total of 772 students participated in the study. Female to male ratios were 3:1 in the BA (Communication) subjects involved. Modal age range was 17-19 years. The participants who used the first set of discussions (using bulletin boards) were not involved in the second set (using real-time chat).
Materials: The test instrument employed in this study was the Bales Interaction Process Analysis.
Table 1 (note the layout here and use of italics)
Bales IPA areas, and categories
|
|
Categories (paired) |
|
|
SOCIO-EMOTIONAL AREA |
1. Seems Friendly |
12. Seems Unfriendly |
|
2. Shows Tension Release |
11. Shows Tension |
|
|
3. Agrees |
10. Disagrees |
|
|
TASK AREA |
4. Gives Suggestion |
9. Requests Suggestion |
|
5. Gives Opinion |
8. Requests Opinion |
|
|
6. Gives Orientation |
7. Requests Orientation |
|
Procedure: Participants were randomly assigned to online groups, which varied in size (5, 7, 9 or 11 members). Sixty-four groups used the first in-house bulletin board system to discuss both topics; 29 real-time groups later used the real-time chat program, Internet Relay Chat (or IRC) with both topics. Asynchronous group duration was three weeks, real-time groups duration varied but was usually finalised within an hour. All participants needed to access the special computer facilities, which were only accessible through university computer labs.
All of the groups' transcripts were electronically recorded and stored. The origin of the raw data for this study was the indexed transcripts for each computer-mediated group. The text unit was the sentence, which was given a score of 1 to 12 corresponding to the 12 Bales categories. The dependent variables were the observed frequency counts of each of the 12 Bales IPA categories appearing in each group. Predictor variables consisted of modality (asynchronous or real-time), group size (five, seven, nine or eleven members), and topic (retrenchment or AIDS).
Statistics:
An ANOVA study was performed
on the 12 Bales IPA categories with modality, size and topic as
predictor variables.
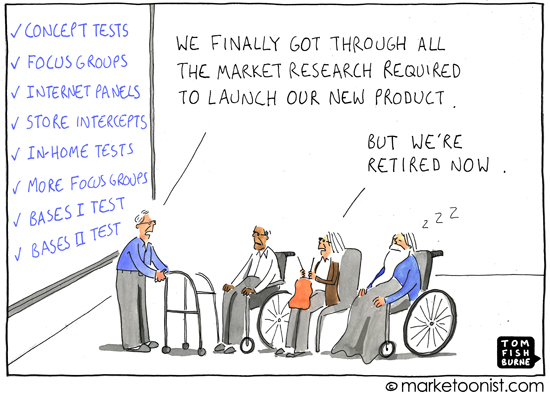
Exercise 5.2: Media Spotlight - World University Rankings - are they valid?
Have a look at the following link (http://www.timeshighereducation.co.uk/world-university-rankings/)
and the links below left. This is the Times Annual World University
Rankings. The main issues here are not the quantifiable research
output, or even the teaching evaluation, but the much more highly
debateable, global reputation of universities. The article on the right
gives a few thoughts on how can any "expert" can understand the staff,
student or general public sense of what constitutes a good or bad
reputation. Check the Times study's Method, and critique the annual
reputation (or quality) rankings. Give your view after looking at the
website about this annual survey? What is missing in the Method?
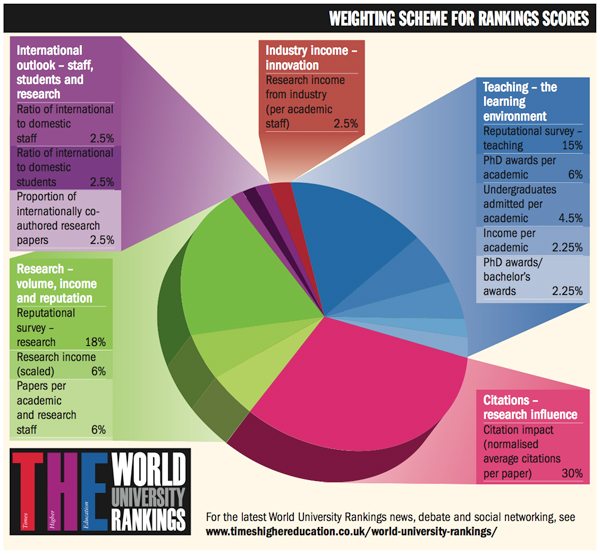 World University Rankings 2011-2012 - Analysis The publication of the Times Higher Education World University Rankings has become one of the key annual events in the international higher education calendar. They are used by undergraduate and postgraduate students to help select degree courses, by academics to inform career decisions, by research teams to identify new collaborative partners, and by university managers to benchmark their performance and set strategic priorities. As nations across the globe focus on the establishment of world-class universities as essential elements of a dynamic economy, our rankings are increasingly employed as a tool for governments to set national policy. Below, Times Higher Education offers analysis and commentary on the world rankings results, and outlines the full methodology of Reputation. Informed opinion at the heart of the matter (this is the Method section, could you replicate the study from this information?) Thousands worldwide have responded to our Academic Reputation Survey, whose rigorous methodology addresses common concerns and shows what scholars really think Each year, tens of thousands of academics from all over the world receive an important email. It is an invitation from Times Higher Education and Thomson Reuters to take part in the annual Academic Reputation Survey, carried out by Ipsos. "You have been statistically selected to complete this survey and will represent thousands of your peers," it says. "The scholarly community, university administrators, and students worldwide depend on the survey results - they provide the most reliable access to the voice of scholars like you." The survey, available in nine languages, uses United Nations data to ensure that it is properly distributed to reflect the demographics of world scholarship. Those who give their time and expertise to complete the survey do so with no more incentive than the opportunity to see a summary of the results, plus a few free electronic copies of Times Higher Education magazine: there is no prize draw, no gimmick, and the survey does not allow volunteers or nominations. It simply gathers academics' opinions on the quality of research and teaching in institutions within their disciplines and with which they are familiar. Despite these strict rules to ensure rigour, the engagement from the global scholarly community has been extraordinary. In the first exercise, carried out in March-April 2010, 13,388 responses were received. In the second round, conducted in April-May 2011, none of the original respondents was asked to take part - yet 17,554 of those contacted replied, a 31 per cent increase on the response rate in the first year. (So what was the return rate?) In fewer than four months spread over two years, just under 31,000 academics from 149 countries engaged with the exercise. The respondents overwhelmingly have been experienced, senior academics. Almost three-quarters have identified themselves as academic staff, with the majority working full-time. The average respondent has worked at a higher education institution for 16 years. There is a balanced spread across disciplines: about 20 per cent of respondents hail from the physical sciences, a figure matched by engineering and technology, with 19 per cent from the social sciences, 17 per cent from clinical subjects, 16 per cent from the life sciences and 7 per cent from the arts and humanities. In terms of geographical spread, some 44 per cent of respondents in 2011 reside in the Americas, 28 per cent in Europe, 25 per cent in Asia Pacific and the Middle East, and 4 per cent in Africa (these numbers have been rounded). The use of reputation surveys in university rankings has long been controversial. Famously, one of the most powerful criticisms was made by writer Malcolm Gladwell in a February 2011 article in The New Yorker, "The Order of Things: what college rankings really tell us". In a popular domestic US ranking, college presidents were asked to grade every school in their category on a scale of one to five, with some asked to rate up to 261 institutions. Gladwell wrote that it is "far from clear how one individual could have insight into that many institutions" and argued that such exercises revealed nothing but "prejudices". But Michael Bastedo, an educational sociologist at the University of Michigan who has studied reputational indicators in university rankings, was quoted by Gladwell as saying that such surveys can work - for example, when academics in a particular discipline are asked to rate others in their field. Such respondents "read one another's work, attend the same conferences, and hire one another's graduate students, so they have real knowledge on which to base an opinion", Bastedo said. This is the approach taken for the Times Higher Education World Reputation Rankings, and it is one that Bastedo has recommended to other rankers. In the Academic Reputation Survey used by THE, scholars are questioned at the level of their specific subject discipline. They are not asked to create a ranking or requested to list a large range of institutions, but to name just a handful of those that they believe to be the best, based on their own experience (no more than 15 universities from a list of more than 6,000). To help elicit more meaningful responses, respondents are asked "action-based" questions, such as: "Which university would you send your most talented graduates to for the best postgraduate supervision?" The survey data were used alongside 11 objective indicators to help create the 2011-12 World University Rankings, published last October. They now stand alone, for transparency's sake. Calculating the scores The reputation table ranks institutions according to an overall measure of their esteem that combines data on their reputation for research and teaching. The two scores are combined at a ratio of 2:1, giving more weight to research because feedback from our expert advisers suggests that there is greater confidence in respondents' ability to make accurate judgements regarding research quality. The scores are based on the number of times an institution is cited by respondents as being "the best" in their field of expertise. Each respondent was able to nominate a maximum of 15 institutions. The number one institution, Harvard University, was selected most often. The scores of all other institutions in the table are expressed as a percentage of Harvard's score, set at 100. For example, the University of Oxford received 71.2 per cent of the number of nominations that Harvard received, giving it a score of 71.2 against Harvard's 100. This scoring system is different from the one used in the World University Rankings and is intended to provide a clearer and more meaningful perspective on the reputation data in isolation. The top 100 universities by reputation are listed, but Times Higher Education has agreed with data supplier Thomson Reuters to rank only the top 50 because the differentials between institutions after the top 50 become very narrow. The second group of 50 institutions are listed in groups of 10, in alphabetical order. Scores are given to one decimal place, but were calculated to a higher precision. |
 Melbourne University regarded top in country, but reputation isn't everything http://theconversation.edu.au/melbourne-university-regarded-top-in-country-but-reputation-isnt-everything-5874 Melbourne University is Australia's most highly regarded tertiary institution among academics, according to a global survey that ranks universities by reputation. Melbourne came 43rd in the Times Higher Education 2012 World Reputation Rankings, up two places from last year, followed in next place by the Australian National University, and the University of Sydney at 50. Harvard University once again topped the poll, which is in its second year. Massachusetts Institute of Technology, one of seven US universities in the top 10, came second, followed by Cambridge University. The reputation-based rankings complement the Times' World University rankings, and are based on a survey of academic opinion of more than 17,500 respondents from 137 countries. Times Higher Education Rankings editor Phil Baty said that Australian universities had suffered from an "image problem," but that their reputation was beginning to improve. "All four representatives in the top 100 have risen up the table. This is clear evidence that Australia's universities are rising in stature internationally, while competitors in the US and UK are seeing their global brands suffer," he said. ... ... "Our best universities have excellent research, in clinical medicine for example, agriculture, ecology, applied mathematics, philosophy at ANU - in these areas we're right in the top drawer and we punch way above our weight. But we don't talk about that in our marketing." Professor Marginson said the poll was interesting but not an indicator of "real quality in teaching". "Most academics when they answer these forms don't know much about any institution apart from the one they work in, the one where they did their PhD and a couple of others. I don't think they know what's happening at the other end of their country. "It's not a particularly good indicator of real quality, but what it does tell you is standing - that's quite important because bright staff are more likely to want to teach there and bright staff are more likely to want to go there." Professor Stephen Garton, the University of Sydney's Provost and acting Vice-Chancellor, said the improvement by Sydney, which last year was ranked into the 51-60 band (universities ranked outside the top 50 were put in fields of 10), was "an extremely encouraging result which underlines Sydney's growing international reputation. I congratulate the whole University community for their efforts in bringing about this recognition". ANU was placed in the top 51-60 on the reputation table last year. The University of Queensland made the top 71-80 universities, up from the 81-90 band last year. |
Finally..
Is choosing a university like choosing a SUV vehicle?
Here is a review of some SUV brands:
Chevrolet
-Some newer models have done well in our tests, but older designs are
sub par. Performance and reliability varies significantly by model.
Dodge - Dodge
SUVs have been disappointing in our testing, typically among the
lowest-scoring models. But lately we've seen some improvement in
reliability.
Ford -The
reliability of Ford models has improved; most are now average or
better. But the driving experience is a mixed bag, especially with the
SUVs.
Honda -
SUVs are typically very reliable and have consistently high test
scores, excelling in road manners, packaging, fuel economy, and safety.
Hyundai -
Hyundai and its sister company Kia form Korea's entry in the SUV
market. Overall quality has improved markedly in the past few years and
both Hyundai and Kia models are well made and reliable.
Kia - Hyundai
and its sister company Kia form Korea's entry in the SUV market.
Overall quality has improved markedly in the past few years and both
Hyundai and Kia models are well made and reliable.
Nissan - Nissan
models usually perform well, but in our annual survey, model-to-model
reliability ranges from much better than average to much worse. Nissan
offers car-based and truck-based SUVs, with the later emphasizing
off-road capability.
Toyota - Toyota
SUVs generally score well in Consumer Reports testing, with good fuel
economy, performance, reliability, and safety. Common highs
include quietness, powertrains, ride comfort, controls, and fit and
finish. Lows have been agility and steering feel. Toyota has several
models that are among the top-rated SUVs in their classes.
What are the main differences between SUV's and
universities? What SUV brands are missing? Could a survey of SUV
"experts" be seen as a valid way to choose a new car? Is it possible
for somone to have experience with all these brands of vehicle? Or is a
survey of SUV users a more reliable way to judge quality, reputation
and value? If you think a user survey is better, then why trust the
Times' research which employs experts, as opposed to students? The
problem with surveys such as these is that decision makers around the
world actually believe them, leading to overseas students perhaps NOT
coming to Australia in order to study here. Last year, the Univ of
Sydney lost many overseas students leading to a massive budget deficit
of over $20 million.